话不多说,拿起键盘干就完了。
目前我已经有了3个服务端的提供实例
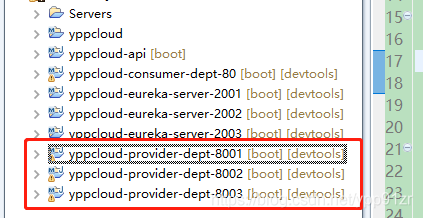 8001 8002 8003
新建一个子模块,监控服务Hystrix Dashboard
引入相关依赖:
<!-- hystrix和 hystrix-dashboard相关--> <dependency> <groupId>org.springframework.cloud</groupId> <artifactId>spring-cloud-starter-hystrix</artifactId> </dependency> <dependency> <groupId>org.springframework.cloud</groupId> <artifactId>spring-cloud-starter-hystrix-dashboard</artifactId> </dependency>application.yml:
server: port: 6001创建一个启动类,添加注解@EnableHystrixDashboard:
package com.ypp.springcloud; import org.springframework.boot.SpringApplication; import org.springframework.boot.autoconfigure.SpringBootApplication; import org.springframework.cloud.netflix.hystrix.dashboard.EnableHystrixDashboard; @SpringBootApplication @EnableHystrixDashboard // 服务监控注解 public class ConsumerHystrixDashboardApplication { public static void main(String[] args) { SpringApplication.run(ConsumerHystrixDashboardApplication.class, args); } }服务提供端添加依赖:
<!-- actuator监控信息完善 Eureka status、HystrixDashborad监控信息页面 --> <dependency> <groupId>org.springframework.boot</groupId> <artifactId>spring-boot-starter-actuator</artifactId> </dependency>启动整个Spring Cloud,本机电脑配置低的基本扛不住。
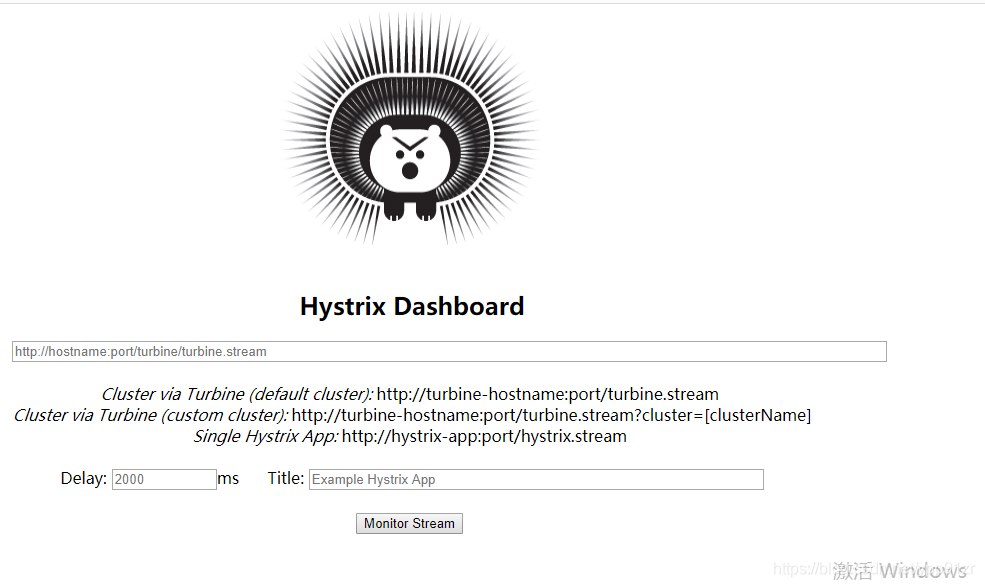
输入刚才HystrixDashboard配置的端口 localhost:6001/hystrix
出现以下页面表示监控配置成功:
如何查看服务访问的监控?
按照它的格式输入:http://localhost:8001/hystrix.stream ,必须按照它的格式输入地址,这里我监控8001服务实例,等下3个服务端全部都来看
1:Delay:该参数用来控制服务器上轮询监控信息的延迟时间,默认为2000毫秒,可以通过配置该属性来降低客户端的网络和CPU消耗。
2:Title:该参数对应了头部标题Hystrix Stream之后的内容,默认会使用具体监控实例的URL,可以通过配置该信息来展示更合适的标题。
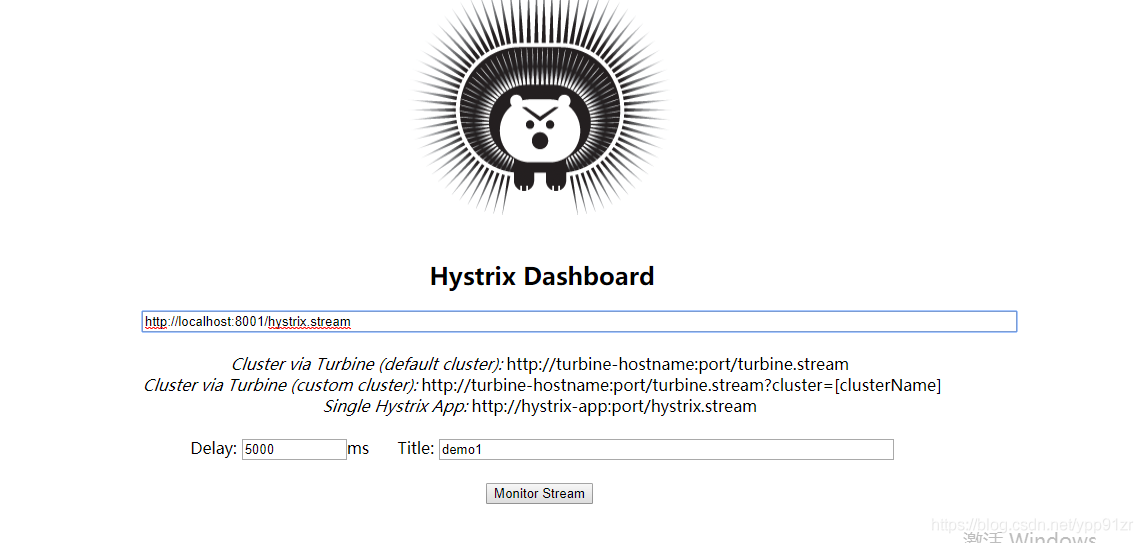
点击Monitor Stream 出现页面:
我配置的间隔5秒
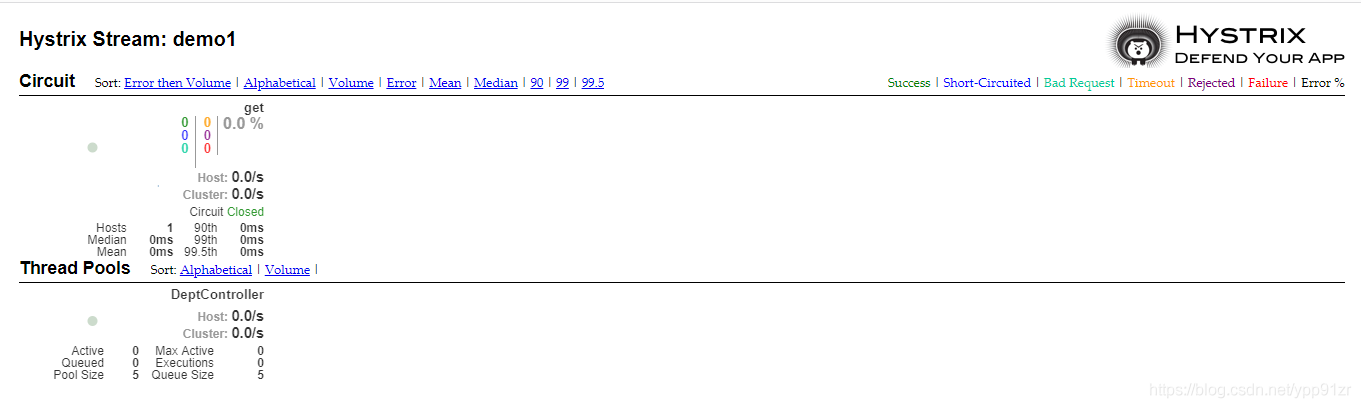
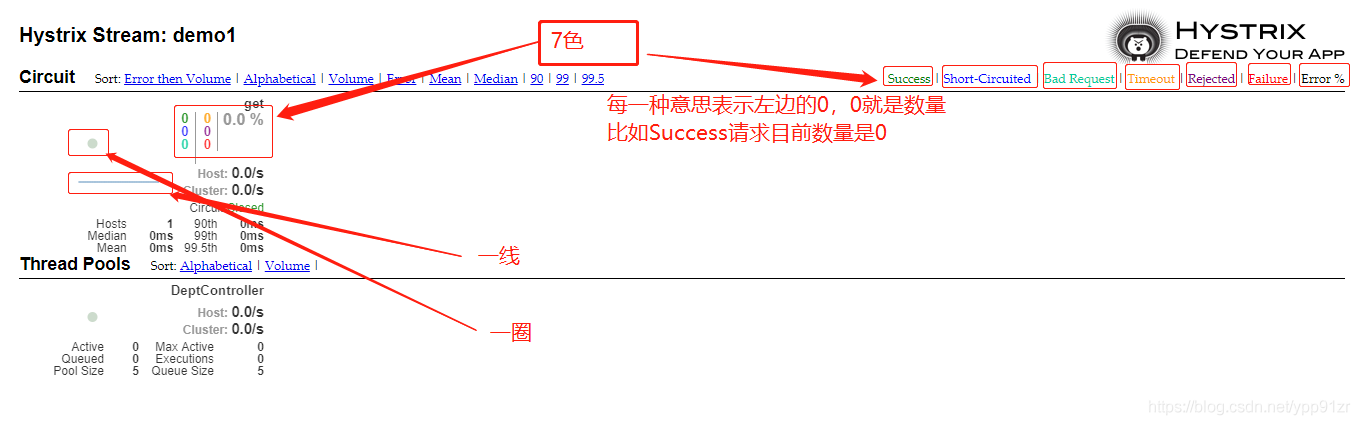
怎么看这个图?
7色,1圈,一线
发送请求,来看看。目前是这个是8001的,我将8002 8003所有的服务实例全部打开来看
开3个页面查看监控信息,8001 8002 8003,发请求
发送很多请求之后,可以看到每个微服务监控左边的圆圈一直在大小不停变换,请求量越来越多,如果越大越红,说明这个服务已经很危险了
那条线也一直在起伏不定,直线说明基本没请求,线越高请求量也就越大。Success数量也一直在变,都是在统计当前微服务的情况,监控
突然想到了美国一些大片的国防部的场景,一个大屏幕全是这些监控统计信息